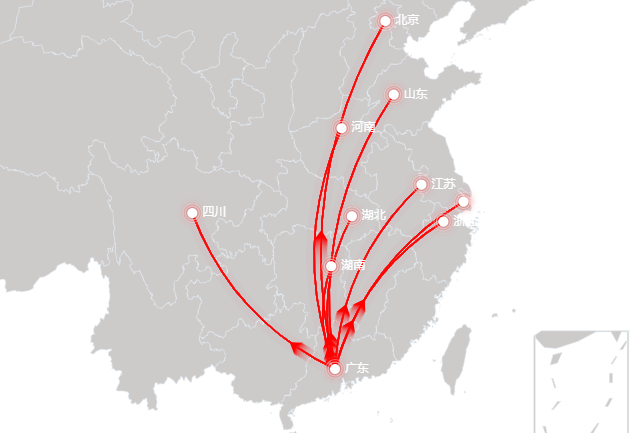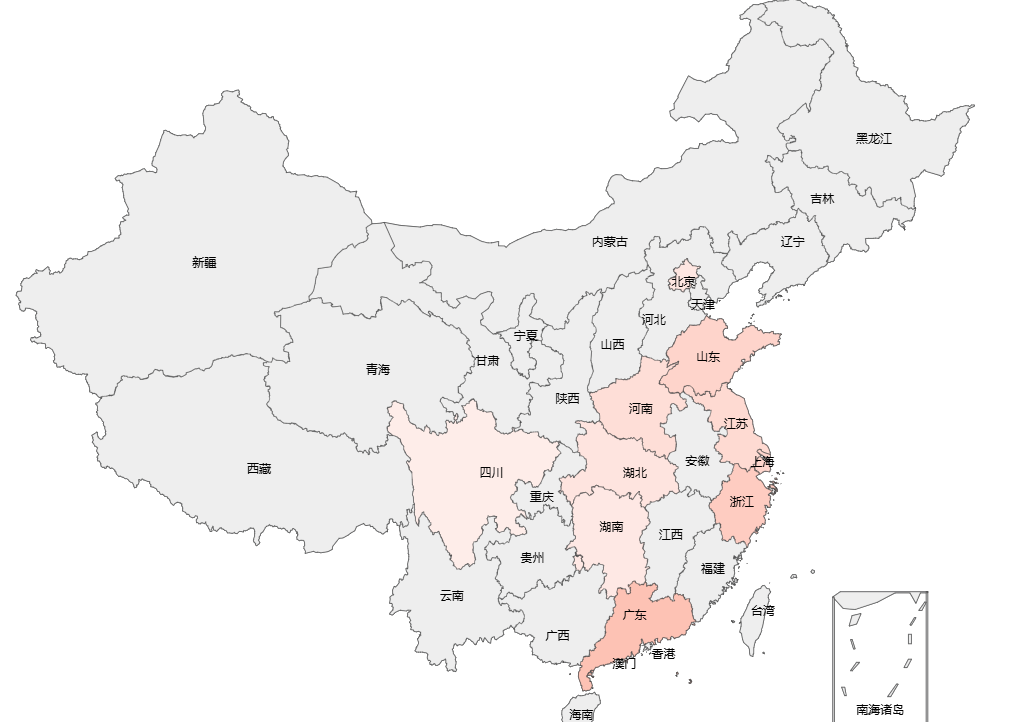

热力图代码(动态的在附件):
<!DOCTYPE html>
<html style="height: 100%">
<head>
  <meta charset="UTF-8">
  <title>中国地图热力图</title>
  <!-- 引入 ECharts -->
  <script src="echarts.js"></script>
  <!-- 引入中国地图扩展 -->
  <script src="china.js"></script>
</head>
<body style="height: 100%; margin: 0;">
  <div id="map" style="height: 100%"></div>

<script>
    // 初始化 ECharts
    var chart = echarts.init(document.getElementById('map'));

    // 示例数据:每个省份的数值
    var data = [
        { name: '北京', value: 120 },
        { name: '上海', value: 200 },
        { name: '广东', value: 300 },
        { name: '江苏', value: 180 },
        { name: '浙江', value: 250 },
        { name: '四川', value: 90 },
        { name: '湖北', value: 130 },
        { name: '湖南', value: 110 },
        { name: '山东', value: 210 },
        { name: '河南', value: 160 }
    ];

    // 配置项
    var option = {
        title: {
            text: '全国热力图',
            left: 'center'
        },
        tooltip: {
            trigger: 'item'
        },
        visualMap: {
            min: 0,
            max: 1000,
            left: 'left',
            inRange: {
                color: ['#ffffff', '#f93205']
            },
            text: ['高值', '低值'],
            calculable: true
        },
        geo: {
            map: 'china',
            type: 'map',
            roam: true,
            label: {
                show: true,
                color: '#fff'
            },
            itemStyle: {
                areaColor: '#2a333d',
                borderColor: '#111'
            }
        },
        series: [{
            name: '数值',
            type: 'map',
            map: 'china',
            roam: false,
            label: {
                show: true
            },
            data: data,
        }]
    };

    // 使用配置项渲染图表
    chart.setOption(option);
</script>
</body>
</html>
附件(demo是热力图、line是动态图):